One of the elements I want to have is a 3D globe that will show how much money is invested in each country via all the mutual funds managed by the bank.
I don’t want the globe to just be something pretty to look at. It also needs to respond to mouse events such as when a user clicks on a country.
How to go about this?
A lot of Googling led me to these useful articles,
- How to make a 3D Globe (Mathematica Stack Exchange)
- CSS Shaders (Altered Qualia)
- Spinning Globe (Peter Collingridge)
The Mathematica Stack Exchange question gives a great breakdown of the different approaches one can use. However, the code shared is dependent on the Mathematica software.
This is where Altered Qualia’s article comes into play. Though it focuses on using CSS Custom Filters to generate a 3D globe from a 2D map, the code shared is general in application. Specifically,
For getting X, Y, Z coordinates corresponding to our U and V coordinates we’ll use a transformation between spherical coordinate system and Cartesian coordinate system:
φ = uv.x * π * 2.0;
θ = uv.y * π;

x = r * sin( θ ) * cos( φ );
y = r * sin( θ ) * sin( φ );
z = r * cos( θ );
Where,
r is the radius
θ is the inclination ranging from 0 to π
φ is the azimuth ranging from 0 to 2π
With this handy formula, any 2D coordinates can be projected onto a 3D sphere.
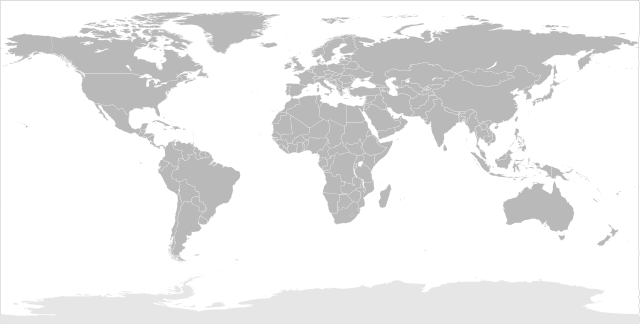
I got an equirectangular map from Wikipedia. (Equirectangular seems to be the most commonly used projection for sphere mapping…)
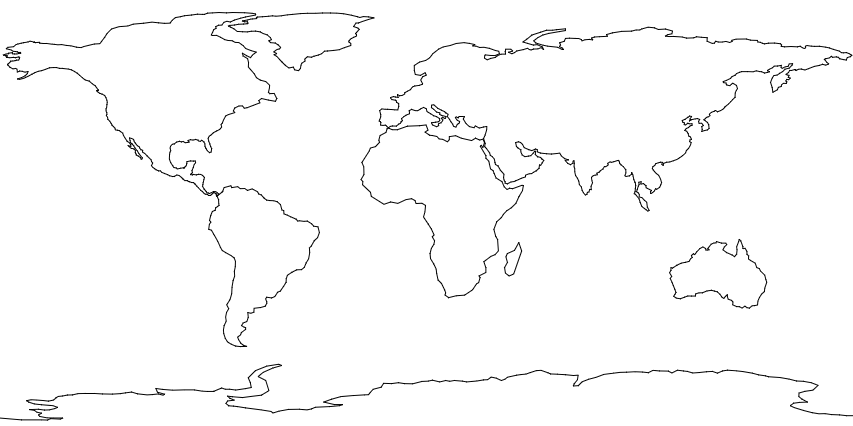
To test out the approach, I opened up Inkscape and roughly traced the map using only straight lines. (Straight lines because I wanted just the shape defining vertices). I then opened up the generated SVG in a text-editor and extracted the path data. See rawishCoords.js.
I then used a bit of regex to isolate the vertices. And redrew the map using HTML Canvas and the extracted coordinates to make sure the regex worked. See it in action here
//get pts from d (path)
var myRe = /(-?\d+[\.\d+]*)/g;   //rubular

for( var j = 0; j < rawishCoords.length; j++ ){

    // get coords
    var s = rawishCoords[j].d;
    var coords = s.match( myRe );

    // convert from relative to absolute
    var x0 = 0, y0 = 0;
    var coords2 = [];
    for( var i = 0; i < coords.length; i += 2 ){
        x0 += parseFloat( coords[i] );
        y0 += parseFloat( coords[i+1] );
        coords2.push(x0);
        coords2.push(y0);
    }
    rawishCoords[j].coords = coords2;

    // draw on canvas as test...
    ctx.beginPath();
    ctx.moveTo( coords[0], coords[1] );
    for ( var i = 0; i < coords2.length; i += 2 ){
        ctx.lineTo( coords2[i], coords2[i+1] );
    }
    ctx.closePath();
    ctx.stroke();
}
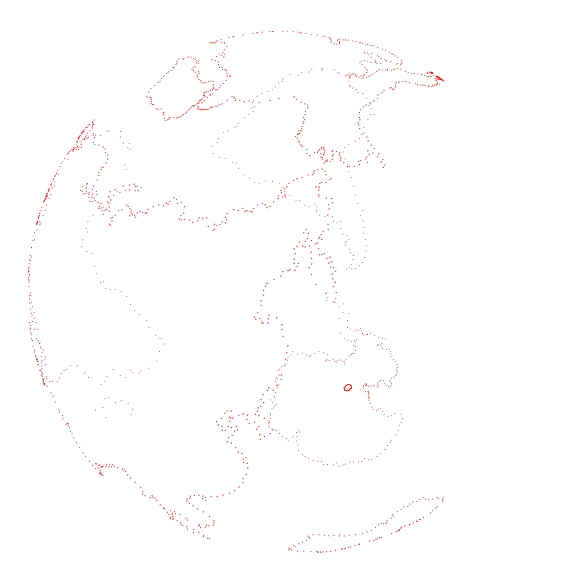
I then applied Altered Qualia’s 3d transform code to change the 2d coordinates to 3d. And chucked them into Three.js. See it in action here (drag your mouse a bit to see the points and rotate the sphere)
Why do all this?
Why not just map an image/texture? Why bother with SVGs and regex to get the country coordinates? My thinking is that somehow knowing the coordinates of each country will be useful for identifying which country the mouse is over when a user clicks. (Maybe I can convert the 3d mouse coordinates to 2d and use SVG’s built-in mouseover/click detection methods for bounded regions… )
Also, I wish to use extrusion of the countries themselves to illustrate the data…which would not be possible if using a simple texture map. Also, particles are cool!