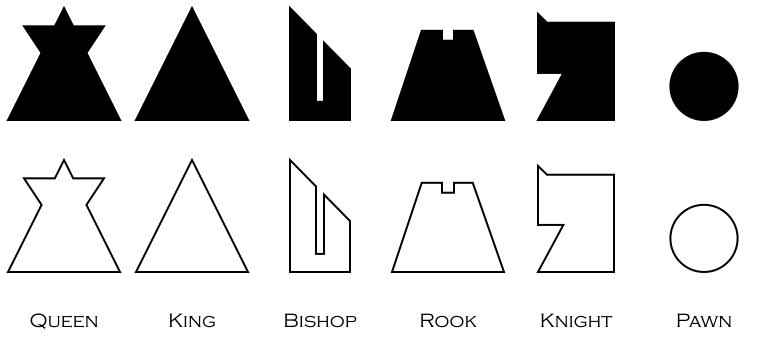
Designed a 2D chess set called “Moderna”.

Designed a 2D chess set called “Moderna”.

One of the elements I want to have is a 3D globe that will show how much money is invested in each country via all the mutual funds managed by the bank.
I don’t want the globe to just be something pretty to look at. It also needs to respond to mouse events such as when a user clicks on a country.
How to go about this?
A lot of Googling led me to these useful articles,
My inspiration for this project is Mr. doob’s CSS 3D Periodic Table. (Be sure to check it out!) I saw it about two years ago and it has since been in the back of my mind to use it as a base UI.
Why visualize mutual funds? People’s interaction with mutual funds tend to be very black box. You put down an initial amount and then get something in the mail every month telling you whether it went up or down in value. But what actually happens to your money?
A tweak to my previous approach.
This time the relative to absolute conversion is done within the JavaScript code itself. This results in less manual work and a more scalable approach.
It’s not quite a raw SVG to JavaScript conversion, but I’m pretty happy with it.
Here it is in action,
I was inspired by the first person to port the SVG Doge to Khan Academy (the link might be to a clone and not the original). I deduced from the highly detailed image that it must have initially been an SVG file because it’s essentially impossible to create it using just the Khan Academy environment. Creating such a detailed image necessitates the use of vector editing software like Illustrator and Inkscape. Also, the decimal precise coordinates were a giveaway that it was imported from somewhere.
I Googled around for a copy of the Doge SVG file, and came across this one shared on Reddit.
After messing around for a bit, I was able to port a portion of it to Khan Academy.