Musings of a Fondue

Project MViz - Update 4

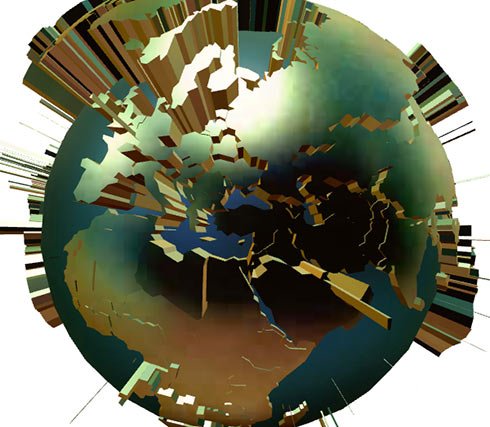
I randomly came across this awesome project by makc. At first I thought it was a rendered photo of a model made by dedicated 3D software like Maya and Blender. But no, it was actually running live on the web using Three.js! Wow.

It is basically the explosion effect I’ve been after, whereby the whole country, not just a bar, extrudes outwards to indicate the value of a data point.

I had been working at this problem for sometime, but my results were rather unspectacular. Also my approach of using only the outlines of the countries meant I was limited in how the coutries could be rendered. Getting the countries' surfaces would require using triangulation, a rabbit hole I wasn’t particularly keen on entering.

Learning Shaders

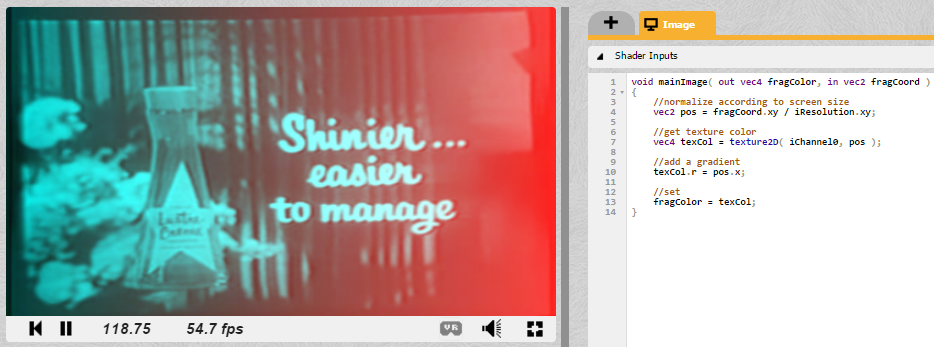
I came across this awesome tutorial series for learning shaders by Omar Shehata of Tuts+.

It is targeted at beginners and has lots of visuals! It also uses ShaderToy, which means you can work through the tutorial online without having to download or setup anything.

If you manage to get through the first bit, you will learn a lot about how photo and video editing software work!

Check it out!

Project MViz - Update 3

How to do picking (i.e. country selection on mouseclick)?

I came across this project by Steve Hall. In it he makes a 3d map using Three.js and D3 that is responsive to mouseover and click events. He also has a great writeup that shares how he tackled the problem.

At the time, I didn't really understand what the article was saying. But two things I did takeaway were,

  1. the use of Three.js’s built-in raycasting to figure out the mouse’s coordinates in 3d space
  2. the use of an algorithm to determine if a point is inside a bounded region

Project MViz - Update 2

One of the elements I want to have is a 3D globe that will show how much money is invested in each country via all the mutual funds managed by the bank.

I don’t want the globe to just be something pretty to look at. It also needs to respond to mouse events such as when a user clicks on a country.

How to go about this?

A lot of Googling led me to these useful articles,

Project MViz - Update 1

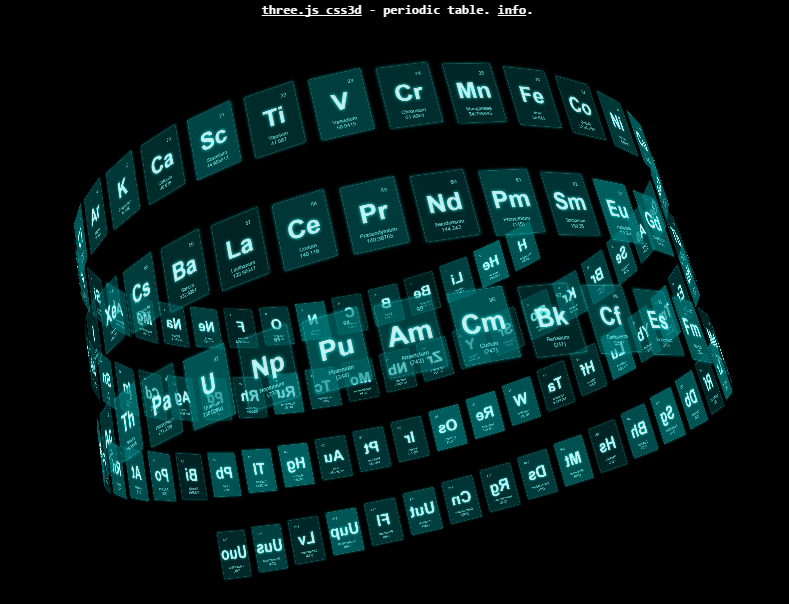
My inspiration for this project is Mr. doob’s CSS 3D Periodic Table. (Be sure to check it out!) I saw it about two years ago and it has since been in the back of my mind to use it as a base UI.

Why visualize mutual funds? People’s interaction with mutual funds tend to be very black box. You put down an initial amount and then get something in the mail every month telling you whether it went up or down in value. But what actually happens to your money?

Three.js Procedural City

I followed this tutorial by Jerome Etienne on generating a procedural city using Three.js.

The tutorial was a way to learn more about Three.js. Most of my time was spent figuring out how to update methods used in the tutorial (r59) that are deprecated in newer versions of Three.js (I was using r73).

See it action here

Three.js Armada Music Video

I wanted to recreate this music video in Three.js. The effects in the video are straightforward, yet mesmerizing. And the simple shapes used seemed like something I could duplicate.

Check out the end result!
Speakers / headphones are a must!

Disclaimer
On my computer, the demo works and is in-synch with the original music video. However, there seems to be variance depending on the machine it’s run on. Also, it has only been tested for Chrome (desktop) and Firefox (desktop). So I hope it works when you view it…

Project Euler 50

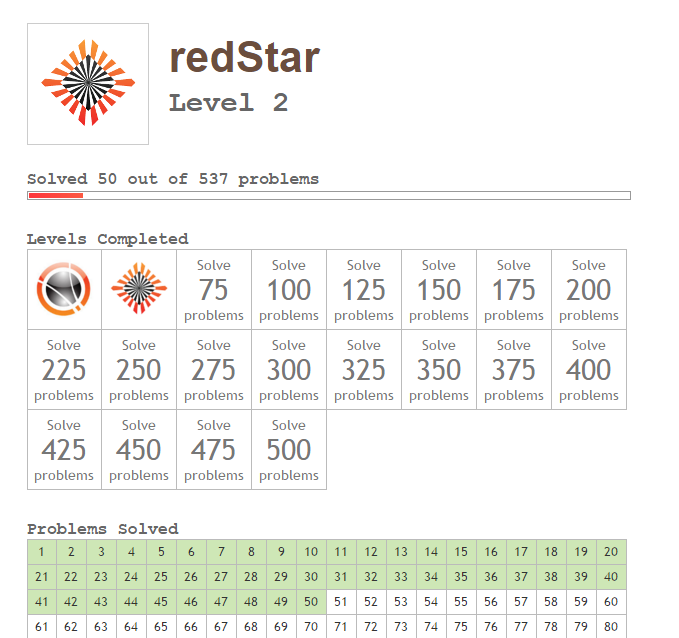
I finished the 50th problem on Project Euler today!

My solutions can be found here. Some are elegant, some epitomize brute force.

Onwards!

My First Flask App

I was trying to get a project I had done earlier up and running on this blog. (Click the picture to see it in action.)

The project relied on a CGI file written in Python being executed by the server.

I first tried a simple upload of my files to Heroku hoping that everything would just automagically work… ha! Of course it didn’t work. What follows is the series of adventures it took to get it working.

Chrome Experiments

Chrome Experiments is an awesome site. There’s a lot of inspiring creations to be found there! Solid hours can be lost exploring the stuff people have shared.

Image

The great thing about it is that all the source code for the experiments is easily available.

I Did the Math

I was watching a clip of Niel deGrasse Tyson and heard him talk about this tweet he had sent in the past.


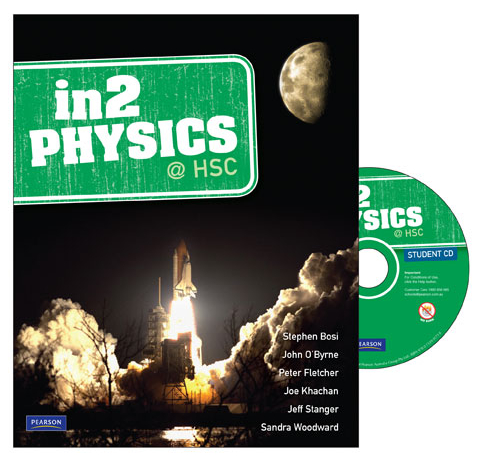
Coincidentally, I had just done the chapter on projectiles from a very awesome textbook I had recently come across.

So, I did the math.

RailsCasts

Checkout RailsCasts by Paul Bates.

They are very well done! And pack a lot of information into 10 minute bites.

He covers a diverse range of topics related to websites such as security, payments, authentication, spam, tagging, data management, and much much more.

Even if you’re not interested in Ruby the language, or the Rails framework, the videos are useful for leveling up on general knowledge of how websites work.

#notSponsored #itsJustThatGood

Flashing a BIOS With Arduino

This was a double team with my brother.

We had a laptop that did not boot and was outside its warranty. After exhaustively checking possible fail points, we narrowed down the likely culprit to a BIOS failure.

Inspired by this Hackaday post, we decided to use an Arduino to flash the chip. The laptop was going to be scrapped otherwise, so we figured we might as well go all out.

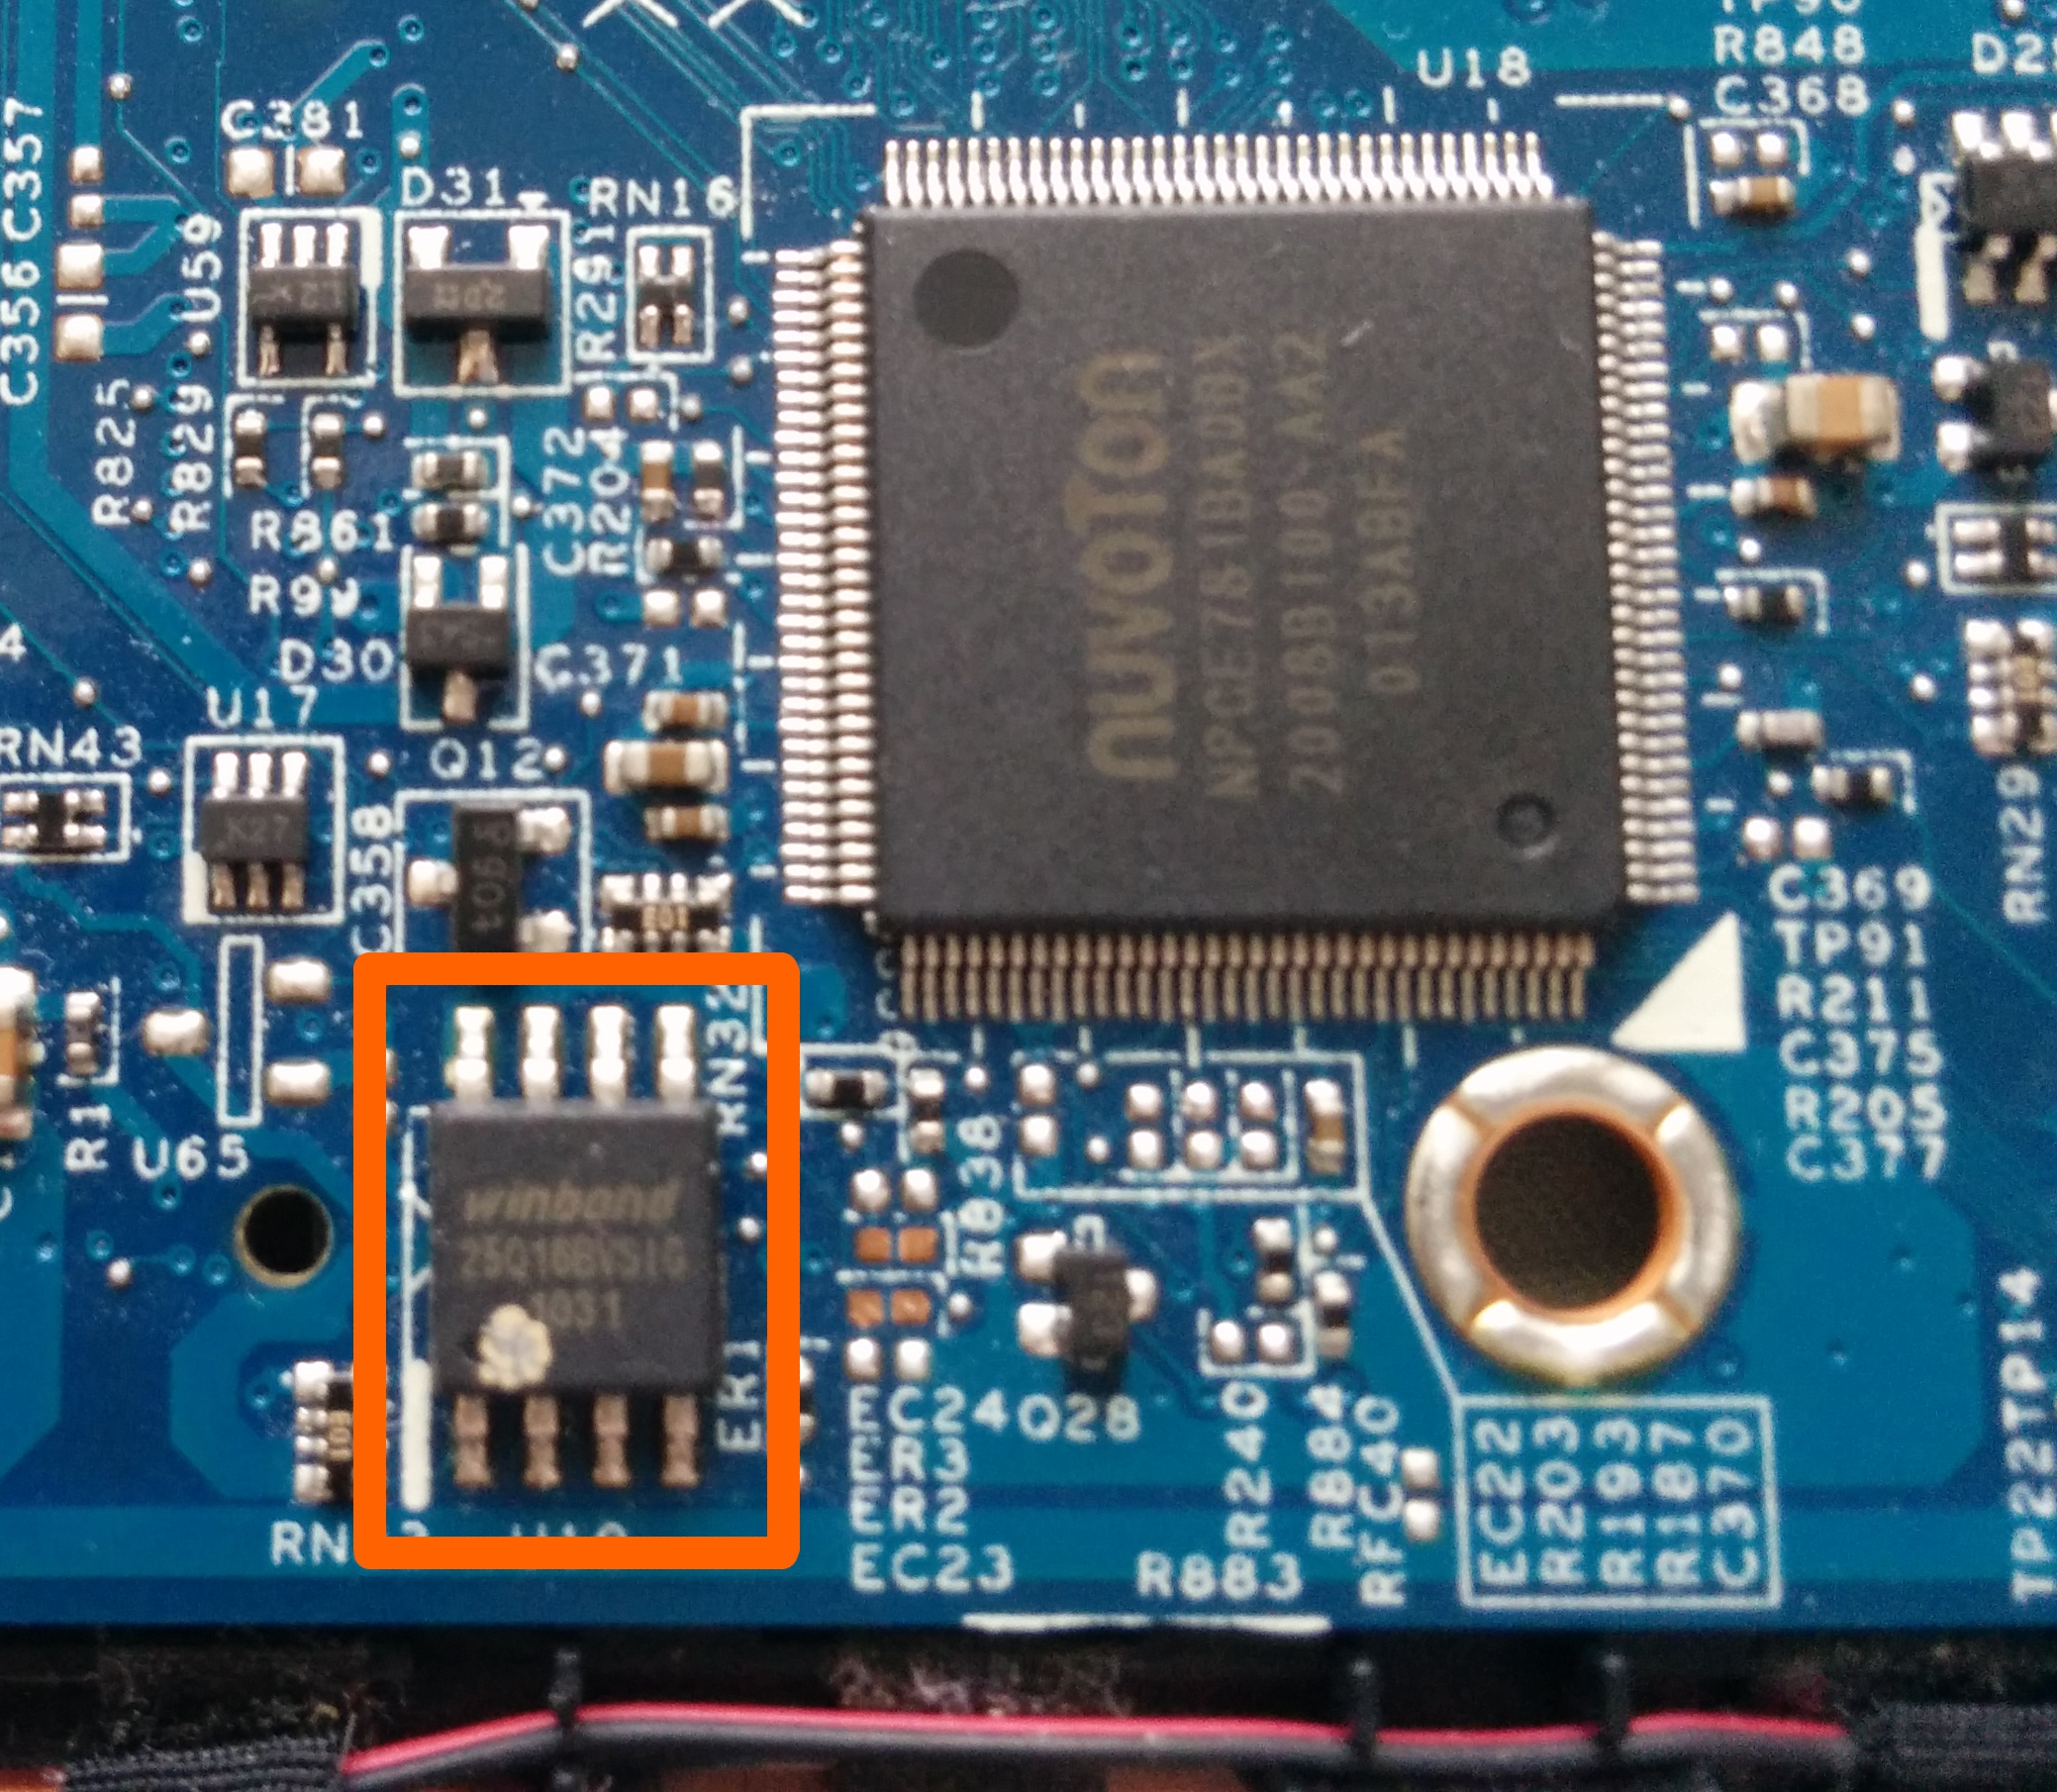
image of BIOS chip

SVG X Khan Academy - Part 2

A tweak to my previous approach.

This time the relative to absolute conversion is done within the JavaScript code itself. This results in less manual work and a more scalable approach.

It’s not quite a raw SVG to JavaScript conversion, but I’m pretty happy with it.

Here it is in action,